SCNT: An R Package for Data Analysis and Visualization of Single-Cell and Spatial Transcriptomics
SCNT: An R Package for Data Analysis and Visualization of Single-Cell and Spatial Transcriptomics
Qing, J.; Wu, J.; Li, Y.; Wu, J.
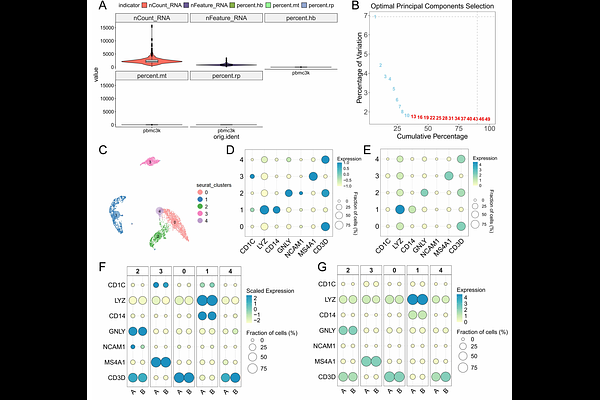
AbstractBackground: The emergence of single-cell (SC) and spatial transcriptomics (ST) has revolutionized our understanding of gene expression dynamics in complex tissues. However, it also presents challenges for data analysis and visualization, particularly due to the complexity of ST data and the diversity of analysis platforms. The SCNT (Single-Cell, Single-Nucleus, and Spatial Transcriptomics Analysis and Visualization Tools) package was developed to address these challenges by providing an efficient and user-friendly tool for processing, analyzing, and visualizing SC and ST data. Results: SCNT is an R-based package that integrates widely used tools such as Seurat and ggplot2, enabling seamless conversion between Seurat and H5ad formats. The package supports high-resolution spatial visualization, including customizable gene expression and clustering plots. SCNT also simplifies key data analysis steps, such as quality control, dimensionality reduction, and doublet detection, significantly enhancing workflow efficiency. We tested SCNT on publicly available PBMC dataset, Visum and Visium HD human kidney tissue data, demonstrating its effectiveness. Conclusions: SCNT offers a valuable tool for researchers exploring SC and ST data. Its simplicity, flexibility, and powerful visualization capabilities provide a streamlined workflow for both novice and advanced users. Future developments will focus on expanding support for additional ST platforms and enhancing multi-omics data integration.